 Web Server Statistics for thecooters.com Web Server Statistics for thecooters.com
(Go To: Top: General Summary: Daily Summary: Hourly Summary: Domain Report: Organization Report: Operating System Report: Status Code Report: File Size Report: File Type Report: Directory Report: Request Report)
This report contains overall statistics.
Successful requests: 7,446
Average successful requests per day: 7,445
Successful requests for pages: 5,661
Average successful requests for pages per day: 5,660
Failed requests: 3,093
Redirected requests: 278
Distinct files requested: 820
Distinct hosts served: 630
Corrupt logfile lines: 133
Data transferred: 419.32 megabytes
Average data transferred per day: 419.32 megabytes
(Go To: Top: General Summary: Daily Summary: Hourly Summary: Domain Report: Organization Report: Operating System Report: Status Code Report: File Size Report: File Type Report: Directory Report: Request Report)
This report lists the total activity for each day of the week, summed over all the weeks in the report.
Each unit ( ) represents 150 requests
for pages or part thereof.
) represents 150 requests
for pages or part thereof.
day: #reqs: #pages: ---: -----: ------: Sun: 0: 0: Mon: 7402: 5661:Tue: 44: 0: Wed: 0: 0: Thu: 0: 0: Fri: 0: 0: Sat: 0: 0:
(Go To: Top: General Summary: Daily Summary: Hourly Summary: Domain Report: Organization Report: Operating System Report: Status Code Report: File Size Report: File Type Report: Directory Report: Request Report)
This report lists the total activity for each hour of the day, summed over all the days in the report.
Each unit () represents 10 requests
for pages or part thereof.
hour: #reqs: #pages: ----: -----: ------: 0: 661: 399:1: 494: 413:
7: 472: 430:
(Go To: Top: General Summary: Daily Summary: Hourly Summary: Domain Report: Organization Report: Operating System Report: Status Code Report: File Size Report: File Type Report: Directory Report: Request Report)
This report lists the countries of the computers which requested files.
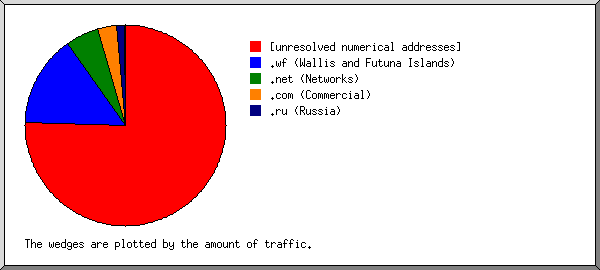
Listing domains, sorted by the amount of traffic.
#reqs: %bytes: domain
-----: ------: ------
 1855: 45.17%: .ru (Russia)
 4131: 38.96%: [unresolved numerical addresses]
 1160: 10.38%: .com (Commercial)
  194:  4.28%: [unknown domain]
   31:  0.44%: .net (Networks)
   14:  0.20%: .de (Germany)
   12:  0.17%: .zw (Zimbabwe)
    9:  0.08%: [domain not given]
    4:  0.07%: .ws (Samoa)
    9:  0.06%: .org (Non Profit Making Organizations)
   13:  0.05%: .co (Colombia)
    5:  0.04%: .us (United States)
    2:  0.03%: .se (Sweden)
    1:  0.03%: .id (Indonesia)
    1:  0.01%: .ca (Canada)
    1:  0.01%: .cl (Chile)
    2:       : .no (Norway)
    2:       : .cc (Cocos (Keeling) Islands)
(Go To: Top: General Summary: Daily Summary: Hourly Summary: Domain Report: Organization Report: Operating System Report: Status Code Report: File Size Report: File Type Report: Directory Report: Request Report)
This report lists the organizations of the computers which requested files.
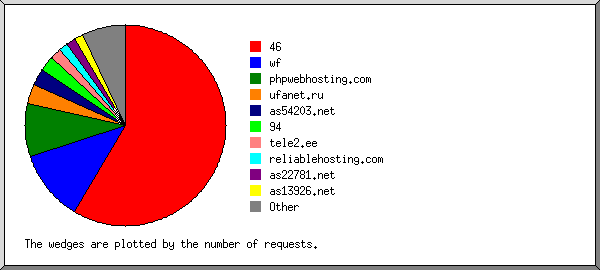
Listing the top 20 organizations by the number of requests, sorted by the number of requests.
#reqs: %bytes: organization
-----: ------: ------------
 2685:  6.30%: 77
 1793: 43.10%: ertelecom.ru
  506:       : phpwebhosting.com
  211:  7.00%: 84
  194:  4.28%: [unknown domain]
  188:  3.66%: google.com
  126:  4.25%: 185.255
  125:  4.23%: 194.150
   94:  1.03%: 102
   90:  2.37%: 87
   83:  0.45%: 82
   82:  0.60%: datapacket.com
   72:  0.98%: 43
   70:  1.16%: 45
   62:  2.08%: hosted-by-vdsina.ru
   58:  1.63%: 14
   57:  0.25%: googlebot.com
   55:  0.46%: geedo.com
   54:  0.44%: 38
   50:  1.54%: 119
  791: 14.21%: [not listed: 144 organizations]
(Go To: Top: General Summary: Daily Summary: Hourly Summary: Domain Report: Organization Report: Operating System Report: Status Code Report: File Size Report: File Type Report: Directory Report: Request Report)
This report lists the operating systems used by visitors.
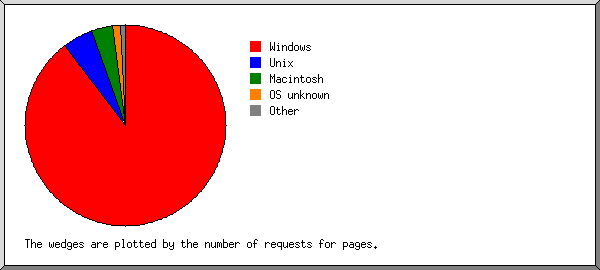
Listing operating systems, sorted by the number of requests for pages.
 #: #reqs: #pages: OS
--: -----: ------: --
 1:  5738:   4955: Windows
  :  5545:   4859:   Windows NT
  :   193:     96:   Unknown Windows
 2:   924:    371: OS unknown
 3:   546:    184: Unix
  :   546:    184:   Linux
 4:   223:    142: Macintosh
 5:    15:      9: Known robots
(Go To: Top: General Summary: Daily Summary: Hourly Summary: Domain Report: Organization Report: Operating System Report: Status Code Report: File Size Report: File Type Report: Directory Report: Request Report)
This report lists the HTTP status codes of all requests.
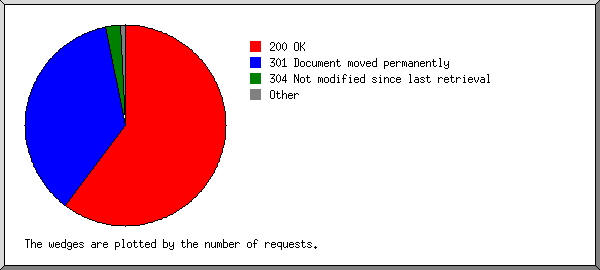
Listing status codes, sorted numerically.
#reqs: status code
-----: -----------
 7444: 200 OK
  278: 301 Document moved permanently
    2: 304 Not modified since last retrieval
    1: 400 Bad request
   14: 403 Access forbidden
 3077: 404 Document not found
    1: 405 Method not allowed
(Go To: Top: General Summary: Daily Summary: Hourly Summary: Domain Report: Organization Report: Operating System Report: Status Code Report: File Size Report: File Type Report: Directory Report: Request Report)
This report lists the sizes of files.
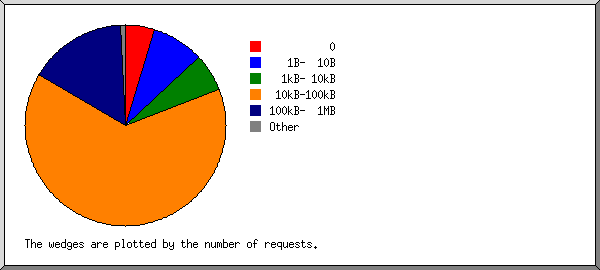
       size: #reqs: %bytes:
-----------: -----: ------:
          0:    15:       :
   1B-  10B:   514:       :
  11B- 100B:    12:       :
 101B-  1kB:   200:  0.02%:
  1kB- 10kB:   815:  0.69%:
 10kB-100kB:  3504: 12.90%:
100kB-  1MB:  2374: 83.25%:
  1MB- 10MB:    12:  3.14%:
(Go To: Top: General Summary: Daily Summary: Hourly Summary: Domain Report: Organization Report: Operating System Report: Status Code Report: File Size Report: File Type Report: Directory Report: Request Report)
This report lists the extensions of files.
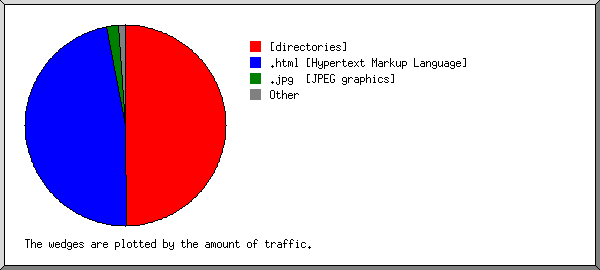
Listing extensions with at least 0.1% of the traffic, sorted by the amount of traffic.
#reqs: %bytes: extension
-----: ------: ---------
 2329: 77.75%: .html [Hypertext Markup Language]
 3332: 11.39%: [directories]
   85:  8.04%: .jpg  [JPEG graphics]
  282:  1.33%: .css  [Cascading Style Sheets]
 1174:  0.48%: .php  [PHP]
  126:  0.45%: .js   [JavaScript code]
   83:  0.35%: .png  [PNG graphics]
    2:  0.18%: .current
   33:  0.04%: [not listed: 6 extensions]
(Go To: Top: General Summary: Daily Summary: Hourly Summary: Domain Report: Organization Report: Operating System Report: Status Code Report: File Size Report: File Type Report: Directory Report: Request Report)
This report lists the directories from which files were requested. (The figures for each directory include all of its subdirectories.)
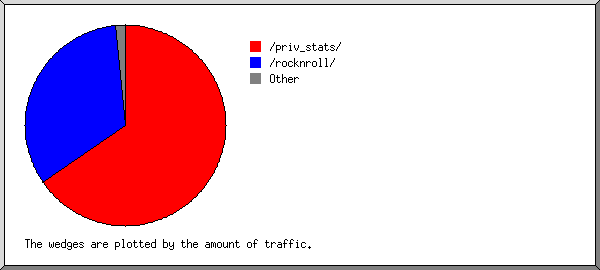
Listing directories with at least 0.01% of the traffic, sorted by the amount of traffic.
#reqs: %bytes: directory
-----: ------: ---------
 5057: 84.26%: /priv_stats/
 2367: 15.73%: /rocknroll/
   22:  0.01%: [not listed: 5 directories]
(Go To: Top: General Summary: Daily Summary: Hourly Summary: Domain Report: Organization Report: Operating System Report: Status Code Report: File Size Report: File Type Report: Directory Report: Request Report)
This report lists the files on the site.
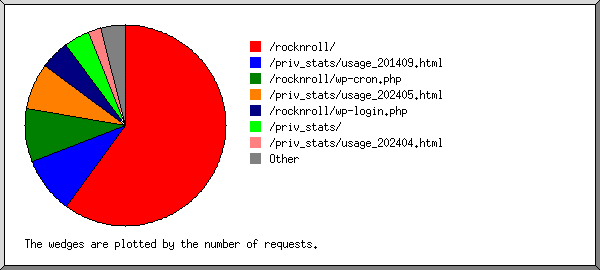
Listing files with at least 20 requests, sorted by the number of requests.
#reqs: %bytes:          last time: file
-----: ------: ------------------: ----
 2726:  6.39%: Jul/20/26 11:45 PM: /priv_stats/
 1434: 45.80%: Jul/20/26 11:59 PM: /priv_stats/usage_202607.html
  553:  0.46%: Jul/20/26 11:59 PM: /rocknroll/wp-login.php
  505:       : Jul/20/26 11:59 PM: /rocknroll/wp-cron.php
  296:  2.33%: Jul/20/26 11:59 PM: /rocknroll/
   24:       : Jul/20/26 10:01 PM:   /rocknroll/?wc-ajax=get_refreshed_fragments
  115:  0.01%: Jul/21/26 12:00 AM: /rocknroll/xmlrpc.php
  102:  3.49%: Jul/20/26 11:59 PM: /priv_stats/usage_202303.html
   70:  2.35%: Jul/20/26 11:47 PM: /priv_stats/usage_201409.html
   68:  2.29%: Jul/20/26 11:28 PM: /priv_stats/usage_202206.html
   63:  2.15%: Jul/20/26 11:56 PM: /priv_stats/usage_202408.html
   47:  1.50%: Jul/20/26 11:45 PM: /priv_stats/usage_202212.html
   42:  1.45%: Jul/20/26 11:57 PM: /priv_stats/usage_202301.html
   40:  1.34%: Jul/20/26 11:54 PM: /priv_stats/usage_202404.html
   36:  1.23%: Jul/20/26 11:51 PM: /priv_stats/usage_202302.html
   29:  0.97%: Jul/20/26 11:34 PM: /priv_stats/usage_202402.html
   27:  0.45%: Jul/20/26 11:18 PM: /rocknroll/wp-content/plugins/jetpack/css/jetpack.css
   27:  0.45%: Jul/20/26 11:18 PM:   /rocknroll/wp-content/plugins/jetpack/css/jetpack.css?ver=7.0.5
   25:  0.86%: Jul/20/26 11:21 PM: /priv_stats/usage_202412.html
   22:  0.74%: Jul/20/26 12:15 PM: /priv_stats/usage_202410.html
   21:  0.71%: Jul/20/26  7:28 PM: /priv_stats/usage_202007.html
   21:  0.72%: Jul/20/26 11:29 PM: /priv_stats/usage_202407.html
   20:  0.68%: Jul/20/26 11:48 PM: /priv_stats/usage_202312.html
   20:  0.13%: Jul/20/26 11:18 PM: /rocknroll/wp-admin/css/login.min.css
   20:  0.13%: Jul/20/26 11:18 PM:   /rocknroll/wp-admin/css/login.min.css?ver=5.1.19
 1164: 23.97%: Jul/20/26 11:59 PM: [not listed: 270 files]
(Go To: Top: General Summary: Daily Summary: Hourly Summary: Domain Report: Organization Report: Operating System Report: Status Code Report: File Size Report: File Type Report: Directory Report: Request Report)


